India’s #1 Award Winning Agency
TABLEAU-QLIKVIEW
Ad2brand has the best professionals imparting quality tableau training in Pune and Dubai. We also conduct qlikview training classes with hands on practice sessions.
- Tableau & Qlikview Training Overview
- Importance of Data in Business
- Advantages of Tableau & Qlikview
- Hands-On Training and Practical Examples
Rating 4.9/5 By 24,576 Clinics
Grow Your Brand
by Partnering with Ad2Brand
TABLEAU-QLIKVIEW

TABLEAU & QLIKVIEW
Data is important in business but many organizations are struggling with data. Professionals who have undertaken Tableau training or Qlikview training have an added advantage over their peers because they have the skill to simplify data into organized and presentable form using the most powerful reporting tools – Tableau & Qlikview. A detailed Tableau, Qlikview training course can help you acquire these skills.
- Tableau & Qlikview are the most easy-to-use and yet interactive business intelligence platforms used by big companies across the world.
- Tableau & Qlikview make data meaningful by making it accessible. This data is later processed for deciding business policies.
- Tableau & Qlikview add value to data and this is the reason why majority of the companies rely on Tableau and Qlikview professionals for sorting out their data-related problems.
There are multiple jobs in “Data Analysis, Tableau, mis reporting” & in “Data Modeling, Qlickview, Business Intelligence” on various job portals (naukri.com)
You may target the following jobs after you go through Qlikview and Tableau training:
- Tableau Developer
- Tableau Architect
- Tableau Technical Lead
- Developer BI visualization and mis reporting using Tableau
- Qlikview Developer
- Qlikview Analyst
- Qlikview Lead/Manager
- Qlikview Admin
WHAT WILL YOU LEARN IN THE QLIKVIEW AND TABLEAU TRAINING COURSE?
- You will learn to build Tableau Data Connections & Qlikview data models.
- You will learn about Data visualization, BI visualization, and Tableau, Qlikview, and mis reporting.
- You will learn about how to implement Qlikview set analysis, Qlikview functions, Tableau Charts, Formatting & Annotations.
- Data Visualization Tools such as Tableau & Qlikview will help you in making effective business decisions and in establishing yourself as an efficient data analyst.
Apart from this, you will have the following benefits:
- Hands-on qlikview and tableau training sessions with practical examples
- Brush up session on SQL
- Live projects with Lab assistance
- Placement Opportunities and Career Enhancement Programs
- Preparation for Tableau Qualified Associated Certification & QlikView Developer Certification
WHO SHOULD OPT FOR TABLEAU AND QLIKVIEW COURSES?
- Individuals who wish to make it big in data analysis & data visualization.
- Qlikview and Tableau training course is ideal for data scientists, business intelligence analysts, data analysts, and BI reporting professionals.
- Professionals from software developing, IT architecture & testing background can also join this course.
PREREQUISITES OR THE REQUIRED SKILL SET
- Basic understanding of SQL
- No prior knowledge of any programming is mandatory however it might be of some help.
Learn tableau , qlikview training classes from one of the best tableau and qlikview training institute in Pune, offering job-oriented training programs.
TABLEAU COURSE SYLLABUS
- Defining Tableau
- What is Data Visualization?
- What are its Scenarios and Objectives?
- Installation and Application
- Architecture of Tableau
- Terminology used in Tableau
- Understanding Tableau Work Space
- Files and Folders
- Views and Dashboard
- Definition of Data
- Terminology of Data
- Types of Data
- Data Roles
- Dimension and Measure
- Continuous and Discrete
- How to Export Data?
- Connecting Sheets
- Understanding Tableau Visualization Engine
- Understanding Data Connections
- Connecting to Tableau Data Server?
- Data Connections
- Joining and Blending
- Defining a Join
- Studying Types of Join
- Usage of Join
- Understanding Right Outer Join
- Custom SQL Enabled
- Studying Data Blending and Tableau
- Usage of Data Blending
- Understanding Kerberos Authentication
- Implementation of Kerberos Authentication
- What is the Need to Organize Data?
- Organization and Simplification of Data
- Implementation of Filtering
- Applying a Filter to a View
- Filtering on Dimensions
- Totals and Sub totals
- Aggregate Measures
- Understanding Data Spotlighting
- Summary Card
- Studying String Functions and Logical Functions
- Learning of Sorting
- Data sorting in Tableau
- Different Types of Sorting
- Combined Fields
- Studying Group and Aliases
- What are Hierarchies?
- Sets & Tableau Bins
- Fixed Size and Variable Sized Bins
- Drilling & its Methods
- Aggregations
- Importance of Formatting and Annotations
- Understanding Spatial Analysis
- Learning built-in Geocoding
- What is Custom Geocoding?
- How to add Caption to Views
- Adding Tooltips to Views
- Using Title Caption and Tooltip
- Formatting the Axes
- Edit Axis Option
- Formatting Window & Mark Labels
- Types of formatting
- What are shading, labels and tooltips?
- Studying Chart Types
- How to Use Dual Charts?
- Understanding Dual Axis
- How to use Combination Charts?
- Using Gantt Charts for Activity Tracking
- Understanding Motion Charts
- What are Box and Whisker Plots
- How to Use Reference Lines and Reference Bands?
- What is Pareto Analysis?
- What are Water Fall Charts?
- How and What of Market Basket Analysis?
- Creating advanced chart
- What are Calculations?
- Strings Date Logical Calculation
- Understanding Arithmetic Calculations
- What are the Aggregation Options?
- Grand Totals and Sub-Totals
- Quick Table & Custom Table Calculations
- Ad-hoc Analytics
- LOD Calculations
- Understanding Parallel Period
- Studying Moving Averages
- Running totals
- Window Averages
- Trend Lines
- Understanding Predictive Models
- Parameters and Locations in Tableau
- Mapping in Tableau
- Importance of Parameter
- Creating a Parameter
- Studying Parameter Controls
- Understanding Mapping
- Modifying Locations within Tableau
- Import and Modify Custom Geocoding
- Exploring Geographic Search
- Studying Pan/ Zoom
- Lasso and Radial Selection
- Uses of parameters
- Reference lines and filters for parameters
- Defining Dashboard
- Building Interactive Dashboards
- What are Action Filters?
- How to create Story Boards?
- Best Practices to create Dashboards
- Cover Pages & Annotations
- Tool Tips and Keyboard Short Cuts
- Sharing work
- Tableau Online
- Tableau Reader
- Tableau Public
- What are filter and URL actions?
- What is use of sheet title?
- Titled Vs Floating sheets
- Measuring values and names
- Uses of measure values and names
- Latitude and Longitude
- What are Special fields and Date hierarchies?
- What are date parts and custom dates?
- Analysis of Tableau
- Using sorting, grouping, trend lines, page shelf
- Reference lines, bands, distributions
QLIKVIEW COURSE SYLLABUS
- QlikView VS Traditional BI
- What is Relational Database?
- Understanding Data Exploration & Data Files
- Dimensions & Measures
- Document Navigation
- Studying Data Slicing & Dicing
- Understanding List-boxes
- Selections in charts
- Search
- Selections of Bookmarking & Selections Undoing
- Understanding Cyclic Groups
- Drill down Groups
- Exploring Containers
- Flowing Data in Qlikview
- Reloading, Publishing, and distributing content
- Defining Scripting
- Connecting to the Database
- Script Syntax
- Data Load & Load Fact Tables
- Data Modeling
- The Data Model Construction
- Data Model Optimization
- Dimensional modelling of data
- Relational databases and ER modeling
- Dimensional modeling
- Joins vs Concatenate
- Creating Star Schema
- The snowflake schema
- Creation of dimensional model
- Dimensional models in QlikView
- Associative data model
- Data Model Challenges
- Cross tables
- Load data from Cross table
- Link tables
- Create a Link table
- Loading the fact table
- Handling list boxes
- Understanding Synthetic Keys
- Removing Synthetic Key from Data Model
- Data load from an Excel file
- Load a table from an Excel file
- Load data from XML file
- Resolving circular loops and synthetic keys
- Defining Data Sources
- Accessing Custom data source
- Third-party Custom connectors
- Table files Reading
- How to extract data?
- OLE DB connection string
- Querying the database
- Script Reloading and Transformation
- Refining the input table
- QVD and QVX files
- Data structures in QlikView (AQL)
- Architecture and components of QV
- Understanding In-memory BI /OLAP
- How to Load data from multiple datasources
- What is Script Editing?
- Menu Commands and Syntax
- How to handle Data Source Files?
- The QWT primary data source
- The QWT secondary data files
- Initializing Script generation
- How to create a connection to the database
- Reading tables into QlikView
- Generating data in the script
- Using Resident load for data generation
- Master Calendar Script
- Mapping tables
- Adding Mapping tables
- Loading tables to the script
- Generating data in the script
- Importance of Design
- The window of Document Properties
- Sheet & Object Properties
- Colours & style
- Captions: colors, content & global font
- Propagate the object appearance
- Set up the default Sheet Object Style
- Hiding captions
- Listboxes
- The Expressions tab
- The Presentation tab
- The Sort tab
- The Number tab
- The Layout tab
- The Font tab
- The Caption tab
- The Multi Box
- The Current Selections Box
- Bookmark Object
- Align and resize the sheet objects
- Selecting objects & Moving objects
- Align the sheet objects
- Importance of Charts & Dashboards
- Chart colors & default color map
- Building the Dashboards
- Expressions & Edit Expression window
- Edit Expression & Report Editor window
- Auto minimize 200
- Charts: Radar, Mekko, Grid, Funnel, Block, Trellis
- Aggregating Data in Script
- Resident Load and Group Function
- Joining tables
- Left, Right, Inner, Outer Joins
- Concatenation
- Sheet Basics & Sheet Objects
- Text, list, chart, graph
- Multidimensional, gauges, multibox
- Calculation and expressions
- Reporting formats & Server setup
- Publisher, Alerts, Bookmark
- Slowly Changing Dimensions
- Interval Match function
- Set Analysis: Cheat Sheet
- AGGR function
- QlikView Data Files – QVD
- Loading data from QVD
- Metadata
- Security & document security
- QlikView Script Syntax
- QlikView Substring Functions
- Optimizing QlikView with Document Analyzer
Why Ad2brand
HIGH SEARCH ENGINE RANKING
SEO Friendly websites that we create help you achieve top rankings on search engines & enjoy high web traffic.
TRIED & TESTED SEO/SEO WEBSITES
Our Ethical White Hat SEO methods make use of the right keywords to popularize your online web store.
CREATIVE CONTENT CREATION
We create Blog, website, Email Content to attract audience by effective content marketing strategies.
100% BRAND VALUE & BRAND INDENTITY
SEO Friendly websites that we create help you achieve top rankings on search engines & enjoy high web traffic.
SOCIAL MEDIA INTEGRATION
Our services include Facebook, Twitter, Pinterest, Instagram, YouTube, Linkedin using Targeted Campaigns.
100% RATE OF CONVERSION
Efficient Email Marketing Services help you to reach out to a wider audience and generate the Highest ROI.
SUCCESSFUL EMAIL CAMPAIGNS
We design customized campaigns after analysing your customers behavior and track them to ensure success.
DEDICATED TEAM OF RESOURCES
We have a dedicated team of digital marketers working for you to ensure the things finish on time and results show.
Pricing
After the details you will provide, we will tell you the actual cost of the Service Well Ad2brand Team to ensure you that we will give you the most desirable Charges.
How It Works
Search for Services
Search smart from hundreds of services in different categories from across the platform
Book Your Service
Choose your services and buy with confidence accompanied with easy buy with hassle-free cancellation support
Make Payment & Track Progress
Get your costing followed by event-based tracking, alerts, and notifications at your fingerprints
Service Delivered
We will mail your document to your desired address. You can track the status of your order anytime during the entire process.
Testimonials
EXCELLENTTrustindex verifies that the original source of the review is Google. Best companyPosted on GoogleTrustindex verifies that the original source of the review is Google. Awesome servicePosted on GoogleTrustindex verifies that the original source of the review is Google. बेस्ट डिजिटल मार्केटिंग सर्विसेस पुणे.. 👆✌🏻Posted on GoogleTrustindex verifies that the original source of the review is Google. good servicePosted on GoogleTrustindex verifies that the original source of the review is Google. One of the best service by ad2brandPosted on GoogleTrustindex verifies that the original source of the review is Google. Gud service 🏆Posted on GoogleTrustindex verifies that the original source of the review is Google. Very goodPosted on GoogleTrustindex verifies that the original source of the review is Google. Best digital marketing companyPosted on GoogleTrustindex verifies that the original source of the review is Google. Very good service by ad2brand digital marketing in punePosted on GoogleTrustindex verifies that the original source of the review is Google. Outstanding digital marketing agency in pune....👆🏻👌🏻
QLIKVIEW & TABLEAU TRAINING – FAQ’S
Ad2Brands tableau and qlikview training is designed by experts as a combo of 2 main BI tools – Tableau and Qlikview, covering all concepts in vast detail. We are the pioneers in Business Intelligence training and give you the best of knowledge to clear global certifications like Tableau Desktop Qualified Associate Certificate, QlikView Developer Certificate and more. Our real time projects and step wise practical assignments will make you experts in using qlikview dashboards, charts and tableau visualizations. Upon completion of this course with us you will feel confident and prepared to apply for jobs in top MNCs and get handsome salary packages.
We have best trainers who are highly qualified and certified and have relevant industry exposure in their fields of expertise, capable of solving all your practical queries.
We help you to install all required software licensed versions for practicals on your machine and give you credentials to use them during your practice sessions.
You can attend a demo session to understand the subject, see the quality of training and interact with the trainer regarding queries to decide your career path. We at Ad2Brand ensure to give you the best training experience with top content and trainers, we also prepare you for interviews and resume preparation and equip you with the best skills in the subject of learning. However, getting the job will depend upon your presentation of skills at the time of interview.
Doubt clearance and resolution of queries is given utmost importance at Ad2Brand. You can raise n number of queries until you get a clear answers for your questions. Our trainers make sure to give individual attention to all students and one-on-one sessions can be arranged with trainers during as well as after completion of the training to get help on the needed topic. Also we make sure to maintain a limited number of students per class to maintain the quality of training and knowledge imparted.
Upon dedicatedly learning all the course material and hands-on practice, you will gain expertise and knowledge in advanced concepts of Tableau , Qlikview as well as Data Science and feel confident enough to crack interviews to get expected jobs in data science industry.
Tableau and Qlikview does wonders by organizing data in the simplest and attractive form making it easy to read and understand. This has helped even small organizations to easily draw buisiness insights from data and use it for better decision making without investing much.
First of all, we would like to clear that there is market and jobs available for both the tools and both have their own pros and cons, nonetheless both are equally useful in business intelligence. Mastering both of them gives you additional skillset and more opportunities as many organizations make use of both of them for data visualization due to their different characteristics. Learning both can open up lots of opportunities and make you a well rounded candidate for selection.
Grow Your Brand
by Partnering with Ad2Brand
OUR CLIENT
Here Is Our Feedback From Our Clients For Digital Marketing Agency In Pune


Recent Blog

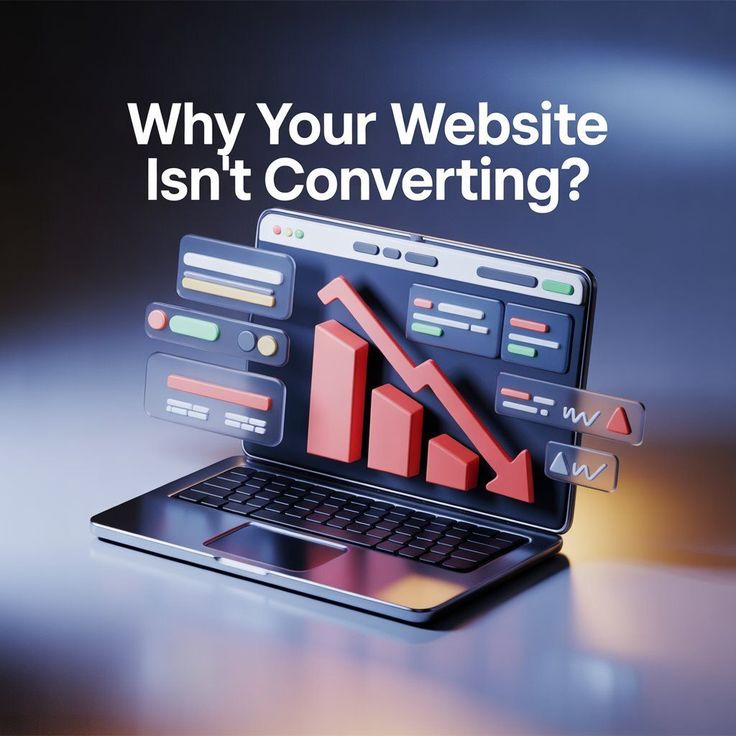
Why Some Business Websites Fail Long Before Their Owners Notice
There is a moment many business owners eventually experience, though few recognize it immediately. The phone rings less often, website inquiries begin slowing down, and marketing campaigns that once generated
The Hidden Revenue Loss Most Outdated Websites Create Every Day
Many business owners focus heavily on attracting new customers. They invest in advertising, social media marketing, search engine optimization, networking, referrals, and sales activities. Significant effort goes into generating visibility

The Warning Signs Your Website May Be Hurting Your Brand Image
A strong brand is built over time. Businesses invest years earning customer trust, delivering quality services, building relationships, and establishing a reputation within their industry. Every customer interaction contributes to
When a Website Starts Costing More Than It Contributes
Most businesses view their website as an asset. It represents the company online, provides information to potential customers, supports marketing campaigns, and helps generate inquiries. For many organizations, the website